
Clinical decision support tools
and information systems
Informed decision-making
for early intervention
Philips clinical decision information systems: making data work smarter for you
Graphical clinical decision support tools such as ST Map, Horizon Trends and ProtocolWatch turn data into clinically relevant, actionable information. Data from multiple clinical parameters are incorporated into innovative, intuitive views which allow clinicians—at bedside or off-site—to catch trends in a patient’s condition at a glance.
Learn more about Philips vital signs monitoring systems and clinical decision support tools.
Horizon Trends
Visual innovations support clinical decision performance
Built into every Philips IntelliVue patient monitor, Horizon Trends is an innovative screen-trend display option that provides graphical representations of changes in vital signs, making deviations instantly clear and enhancing response time. With Horizon Trends enabled, clinicians gain near real-time visual information on how a patient’s measurements compare to baseline or target values, and in what direction overall measurements are trending. This reduces the need to compare current patient data with past data, allowing clinicians to make informed decisions—and act on them—as quickly as possible.

ST Map
A flexible view
The AHA and other professional organizations recommend continuous ST segment monitoring for all acute coronary syndrome (ACS) patients at risk of myocardial ischemia. In multiple contexts, ST segment monitoring is clearly indicated as the only practical approach to continuous, non-invasive monitoring of ischemic episodes. ST Map uses ST values and trends from the vertical (limb leads) and horizontal (chest leads) planes and displays them in an integrated, multi-axis map of a patient’s ST segments. Consistent with American Heart Association and American College of Cardiology guidelines, the unique spatial orientation view of ST Map helps clinicians quickly and easily identify changes at the bedside. ST Map is flexible and easy to use. It offers trend view intervals from 12 seconds to 30 minutes and can be used with 12-lead ECG (both conventional and derived using EASI™ or Hexad method) and standard 5- or 6-lead ECG placement.
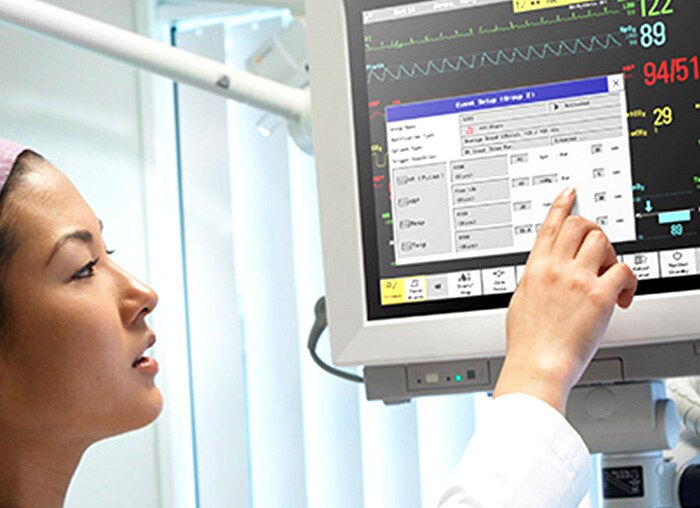
Event Surveillance
Programmable intelligence aids episode detection
With increased visibility comes enhanced capability. Event Surveillance brings valuable clarity to support clinical decision-making. With customizable multi-parameter event triggers that allow for advanced analysis and alerting on significant changes in patient condition, this tool delivers exceptional detection and documentation of patient events. Event Review simplifies event surveillance by allowing caregivers to change event triggers, review stored events and create an event manually. An event summary view shows all stored events, and can be filtered for specific criteria. Events can be printed and added to the patient record as required. Neonatal Event Review features are tailored to NICU needs, providing specialized information for the diagnosis and management of NICU babies.

ProtocolWatch Sepsis
Manage sepsis, systematically
Onset of sepsis is subtle and unpredictable. This presents a challenge in detecting it in time to take the most effective action. ProtocolWatch continually checks patient vital signs and nursing observations against institution-defined sepsis detection criteria, alerting caregivers if the early criteria for sepsis are detected. If early signs of sepsis are detected, the ProtocolWatch Sepsis application prompts clinicians for the appropriate tests, observations, or interventions, as defined by the institution. This configurable “Sepsis Resuscitation Bundle” includes a reminder list of treatments and goals, as well as a Horizon Trend display of key patient measurements. ProtocolWatch Sepsis application also logs protocol stages and caregiver actions; this information can be printed for documentation and quality improvement initiatives.
Histogram Trends
Complete view of clinical measurements
Histograms are a graphical representation of a patient’s measurements over an extended time period. These quantitative reports allow clinicians to quickly assess and effectively evaluate changes in these measurements. Clinicians can see at a glance if there are changes within a set range of values, which provides a clear, specific overview of significant trends without overwhelming the clinician with data. Histograms also support quantitative assessments of a patient’s response to clinical interventions, such as medication titration. Clinicians can also use histograms to monitor and evaluate respiratory rates of pre-term infants in acute care phases. They provide data that aids in optimizing oxygen and ventilator settings, assessing responses to medication and informing discharge planning.
